



Make space decisions with data you can trust
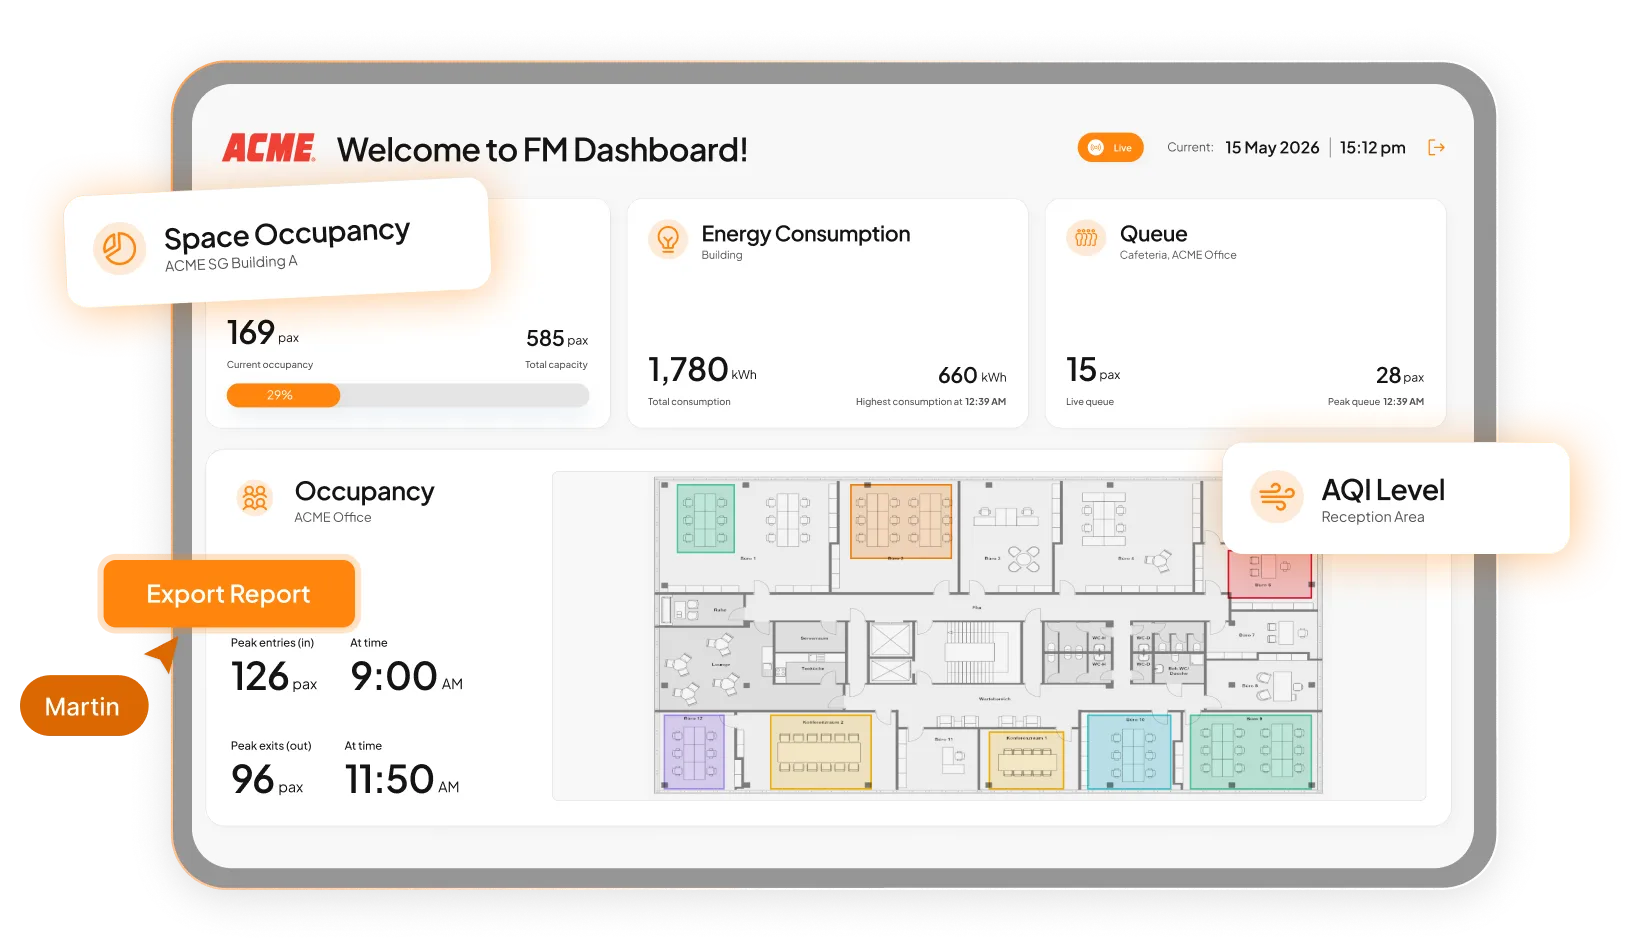
Bookings. Sensors. Badge swipes. Air quality. AthenaAnalytics, the workplace analytics platform from AthenaSpace, overlays them all, so you see how your spaces are really used and what to do about it. In real time, across every location
The Problem
Bookings say one thing. Reality says another.
Booking data is unreliable. Too many apps to export from. Last quarter's spreadsheet is already stale. Without one consistent view of occupancy across time, location and usage type, space gets planned on assumption.
Rooms booked for hours, used for minutes
Meeting rooms appear occupied on booking calendars, even when they're barely used. This creates a misleading picture of actual space utilisation
One person, several devices, one inflated headcount
A single person connecting multiple devices can be counted more than once, making occupancy figures higher than reality
Trends buried in disconnected systems
When data sits across separate platforms, it's difficult to see usage patterns, identify inefficiencies, and make informed space decisions
The Solution
One platform. Every space signal.
AthenaAnalytics is a unified space analytics platform. It pulls in data from room sensors, booking panels, access control, AV devices, IAQ sensors and badge access systems, then overlays it all in one view. Your existing tech stack stays exactly where it is.

All your space data, overlaid
See which spaces are underused, reduce wasted capacity, and make smarter space planning decisions with reliable occupancy data
Real-time and historical, side by side
Monitor what's happening across your spaces now while comparing past usage to identify patterns and changes over time
One source of truth, every location
Access consistent, reliable space insights across all locations, helping teams make informed decisions from the same data
All your space data. Overlayed.
We ingest data from space sensors, booking systems, and access control sources including room sensors, booking panels, AV devices, IAQ sensors, and badge access systems. All of the tech stack you're already using.
Learn more












How it works?
From raw signals to confident decisions
Collect
Capture booking, sensor and utilisation data across every room and shared resource.
Analyse
Spot trends, demand patterns, peak periods and underused areas.
Understand
See how spaces are used, live and over time.
Optimise
See how spaces are used, live and over time.
Modules you can choose from
Pick the questions you need answered
Occupancy
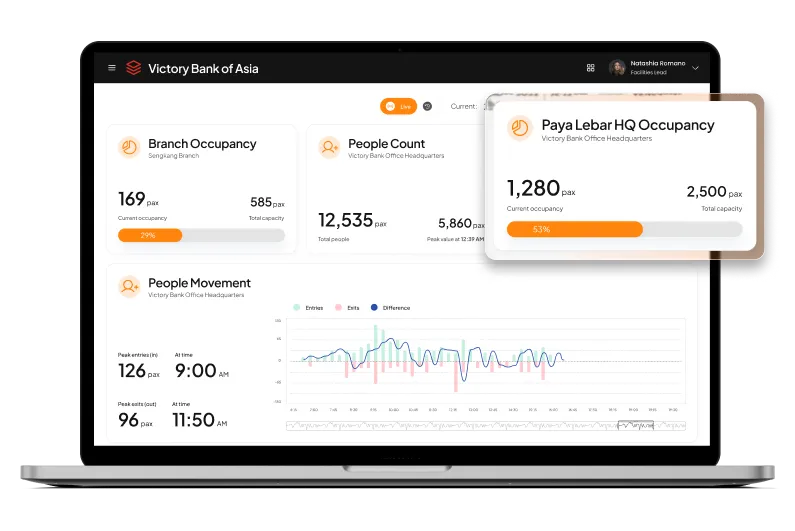
Know exactly how your space is being used, in real time. Monitor branch occupancy, people count, and movement patterns across every location — so your team always has the data to make smarter decisions.
Space utilisation
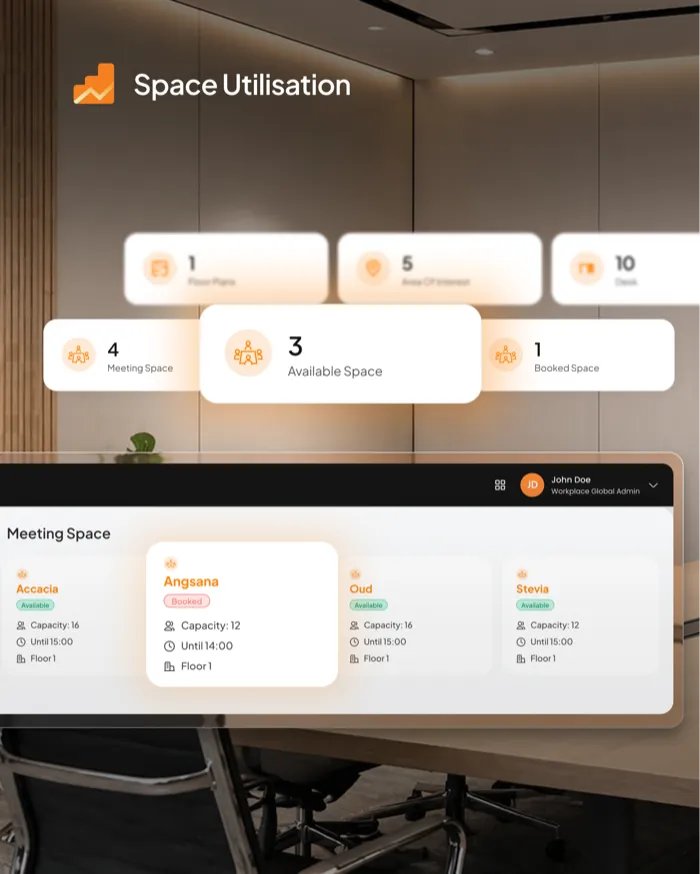
Stop guessing which spaces are working and which ones aren't. Wayfinding data feeds directly into utilisation reports — showing you peak hours, underused zones, and opportunities to redesign for better flow.
Dwell time
Occupancy measures presence. Dwell time measures engagement. See where people linger, hurry or lose interest, then reshape layouts, ease congestion and smooth the visitor journey.
Indoor air quality
CO₂, temperature, humidity, PM2.5 and VOCs, on one dashboard. Spot poor ventilation early, support wellbeing and balance HVAC performance against energy use.
Everything your space data has been trying to tell you
Six ways AthenaAnalytics turns raw signals into decisions.
Space utilisation dashboard
Occupancy, utilisation and key trends on one clear dashboard, built for fast decisions.
Space demand insights
See where demand is building and when, so capacity follows need.
Operational efficiency data
Spot the underused and the overcrowded, with metrics that sharpen workplace planning.
Historical occupancy reporting
Track occupancy over time and uncover the patterns behind better planning and allocation.
Space trends
Peak and average occupancy by hour and day of week, so you know when spaces really get used.
Occupancy and IAQ intelligence
Pair occupancy with indoor air quality signals to see overall building conditions and environmental performance.
Better Together
A room booked every morning tells you one thing. Add occupancy and it tells you another. Add dwell time and you find out why. Add air quality and you see how people shape the conditions around them. AthenaAnalytics overlays all four, so you stop reading each signal alone.
Built for every kind of space
AthenaSpace is industry-agnostic, and AthenaAnalytics is too. Corporate teams find the meeting rooms that are booked but empty. Universities see how many people are in each classroom, and when. Hospitals analyse waiting times and patient flow to ease bottlenecks. Retailers read traffic patterns, busy zones and dwell areas to sharpen layouts and store performance. And facilities, operations, real estate and planning teams get the evidence to back their next decision.
Part of the AthenaSpace platform
AthenaAnalytics works best as part of the wider platform. Alongside AthenaSM for space management, AthenaIAM for asset management and AthenaSignage for digital signage, it links bookings, actual usage, equipment health and live information into one connected view. With integrations into your existing tech stack, it fits how you already work.
Enterprise security by design

ISO 27001
We are an ISO27001 compliant company

GDPR Compliant
EU Personal Data protection certified

Microsoft Azure
Cloud-based software platform onMicrosoft Azure

Customer-controlled data
System access with explicit permission settings
FAQs
Everything you want to know about AthenaAnalytics
What is AthenaAnalytics?
AthenaAnalytics is the space analytics module of the AthenaSpace platform. It brings together sensor, booking and access control data to show how your spaces are really used, across occupancy, utilisation, dwell time and indoor air quality.
Is AthenaAnalytics secure?
Yes. AthenaAnalytics operates within the AthenaSpace platform, which is built with enterprise security standards, controlled access and data protection in mind, so you can be confident in how data is stored, managed and shared.
What can I use these analytics for?
AthenaAnalytics shows how spaces are used, where demand is building, why inefficiencies exist and how conditions perform over time, supporting better planning, smarter operational decisions and a more informed space strategy.
Will the analytics help us save money?
Absolutely. By showing how your space is really used, AthenaAnalytics helps you find underused areas, uncover inefficiencies and get more from the resources you already have, supporting better real estate and space investment decisions over time.
What hardware or sensors do I need?
That depends on the spaces you want to measure and the data you already have. AthenaAnalytics can work with workplace sensors, booking systems, access data and IAQ inputs, so the setup can be tailored to your environment and existing infrastructure.
What can AthenaAnalytics measure?
Occupancy, space utilisation, dwell time and indoor air quality, including CO₂, temperature, humidity, PM2.5 and VOCs. Choose the modules that answer your questions, and keep them in one view.
How is dwell time different from occupancy?
Occupancy tells you how many people are in a space at a given moment. Dwell time reveals how long they stay. Together they show not only how busy a space is, but how effectively it supports the people using it.
Can IAQ data be combined with occupancy analytics?
Yes. Combining occupancy and IAQ data helps you understand how people influence indoor conditions, making it easier to optimise ventilation, manage capacity and improve space performance.
How does AthenaAnalytics pair with the rest of AthenaSpace?
It works best as part of the wider platform. AthenaAnalytics connects with space management, asset management and signage to link bookings, actual usage, equipment health and live information into one connected view of space performance and operational visibility.
How do I get started with AthenaAnalytics?
AthenaSpace is delivered through channel partners across Asia. Book a demo to talk through your spaces and the data you already collect.
See what your spaces are capable of.
Your building is already telling you what's wrong.
AthenaSpace gives you the intelligence layer to hear it — and act on it.